Question:


Answer:
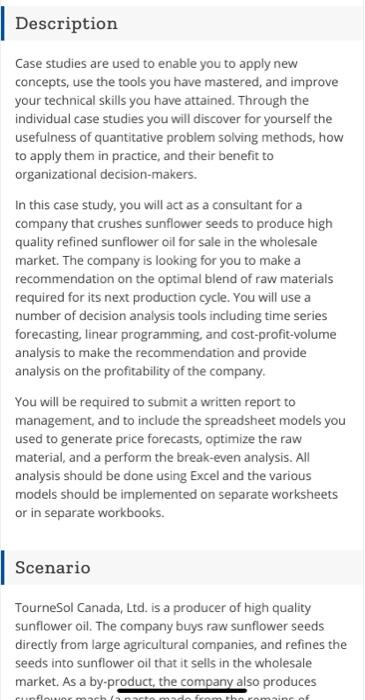
Sol:
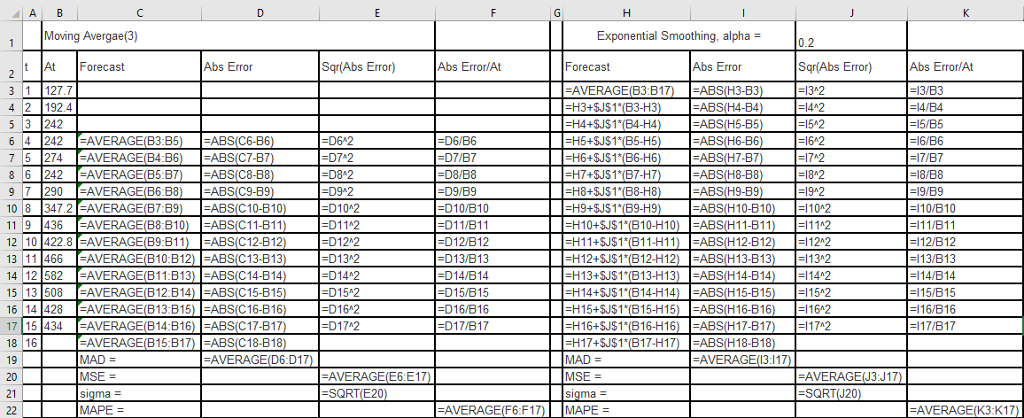
| Moving Avergae(3) | Exponential Smoothing, alpha = | 0.2 | ||||||||
| t | At | Forecast | Abs Error | Sqr(Abs Error) | Abs Error/At | Forecast | Abs Error | Sqr(Abs Error) | Abs Error/At | |
| 1 | 127.7 | 348.94 | 221.24 | 48947.14 | 1.73 | |||||
| 2 | 192.4 | 304.69 | 112.29 | 12609.49 | 0.58 | |||||
| 3 | 242 | 282.23 | 40.23 | 1618.74 | 0.17 | |||||
| 4 | 242 | 187.37 | 54.63 | 2984.80 | 0.23 | 274.19 | 32.19 | 1036.00 | 0.13 | |
| 5 | 274 | 225.47 | 48.53 | 2355.48 | 0.18 | 267.75 | 6.25 | 39.07 | 0.02 | |
| 6 | 242 | 252.67 | 10.67 | 113.78 | 0.04 | 269.00 | 27.00 | 728.98 | 0.11 | |
| 7 | 290 | 252.67 | 37.33 | 1393.78 | 0.13 | 263.60 | 26.40 | 696.98 | 0.09 | |
| 8 | 347.2 | 268.67 | 78.53 | 6167.48 | 0.23 | 268.88 | 78.32 | 6134.06 | 0.23 | |
| 9 | 436 | 293.07 | 142.93 | 20429.94 | 0.33 | 284.54 | 151.46 | 22938.98 | 0.35 | |
| 10 | 422.8 | 357.73 | 65.07 | 4233.67 | 0.15 | 314.84 | 107.96 | 11656.43 | 0.26 | |
| 11 | 466 | 402.00 | 64.00 | 4096.00 | 0.14 | 336.43 | 129.57 | 16788.90 | 0.28 | |
| 12 | 582 | 441.60 | 140.40 | 19712.16 | 0.24 | 362.34 | 219.66 | 48249.45 | 0.38 | |
| 13 | 508 | 490.27 | 17.73 | 314.47 | 0.03 | 406.27 | 101.73 | 10348.19 | 0.20 | |
| 14 | 428 | 518.67 | 90.67 | 8220.44 | 0.21 | 426.62 | 1.38 | 1.91 | 0.00 | |
| 15 | 434 | 506.00 | 72.00 | 5184.00 | 0.17 | 426.90 | 7.10 | 50.48 | 0.02 | |
| 16 | 456.67 | 456.67 | 428.32 | 428.32 | ||||||
| MAD = | 98.40 | MAD = | 101.33 | |||||||
| MSE = | 6267.17 | MSE = | 12122.99 | |||||||
| sigma = | 79.17 | sigma = | 110.10 | |||||||
| MAPE = | 0.172902843 | MAPE = | 0.302962383 |
| Moving Avergae(3) | Exponential Smoothing, alpha = | 0.2 | ||||||||
| t | At | Forecast | Abs Error | Sqr(Abs Error) | Abs Error/At | Forecast | Abs Error | Sqr(Abs Error) | Abs Error/At | |
| 1 | 317.8 | 1015.60 | 697.80 | 486924.84 | 2.20 | |||||
| 2 | 465 | 876.04 | 411.04 | 168953.88 | 0.88 | |||||
| 3 | 662.2 | 793.83 | 131.63 | 17326.98 | 0.20 | |||||
| 4 | 668.2 | 481.67 | 186.53 | 34794.68 | 0.28 | 767.51 | 99.31 | 9861.60 | 0.15 | |
| 5 | 791.3 | 598.47 | 192.83 | 37184.69 | 0.24 | 747.64 | 43.66 | 1905.80 | 0.06 | |
| 6 | 732 | 707.23 | 24.77 | 613.39 | 0.03 | 756.38 | 24.38 | 594.17 | 0.03 | |
| 7 | 951 | 730.50 | 220.50 | 48620.25 | 0.23 | 751.50 | 199.50 | 39800.06 | 0.21 | |
| 8 | 1123 | 824.77 | 298.23 | 88943.12 | 0.27 | 791.40 | 331.60 | 109958.31 | 0.30 | |
| 9 | 1297.3 | 935.33 | 361.97 | 131019.87 | 0.28 | 857.72 | 439.58 | 193230.31 | 0.34 | |
| 10 | 1312 | 1123.77 | 188.23 | 35431.79 | 0.14 | 945.64 | 366.36 | 134222.41 | 0.28 | |
| 11 | 1416 | 1244.10 | 171.90 | 29549.61 | 0.12 | 1018.91 | 397.09 | 157681.27 | 0.28 | |
| 12 | 1664 | 1341.77 | 322.23 | 103834.32 | 0.19 | 1098.33 | 565.67 | 319985.72 | 0.34 | |
| 13 | 1317.4 | 1464.00 | 146.60 | 21491.56 | 0.11 | 1211.46 | 105.94 | 11222.91 | 0.08 | |
| 14 | 1182.4 | 1465.80 | 283.40 | 80315.56 | 0.24 | 1232.65 | 50.25 | 2525.00 | 0.04 | |
| 15 | 1334.4 | 1387.93 | 53.53 | 2865.82 | 0.04 | 1222.60 | 111.80 | 12499.35 | 0.08 | |
| 16 | 1278.07 | 1278.07 | 1244.96 | 1244.96 | ||||||
| MAD = | 286.83 | MAD = | 306.16 | |||||||
| MSE = | 51222.06 | MSE = | 111112.84 | |||||||
| sigma = | 226.32 | sigma = | 333.34 | |||||||
| MAPE = | 0.181893948 | MAPE = | 0.36438398 |
| Moving Avergae(3) | Exponential Smoothing, alpha = | 0.2 | ||||||||
| t | At | Forecast | Abs Error | Sqr(Abs Error) | Abs Error/At | Forecast | Abs Error | Sqr(Abs Error) | Abs Error/At | |
| 1 | 63 | 156.93 | 93.93 | 8823.47 | 1.49 | |||||
| 2 | 87 | 138.15 | 51.15 | 2615.98 | 0.59 | |||||
| 3 | 105 | 127.92 | 22.92 | 525.20 | 0.22 | |||||
| 4 | 111 | 85.00 | 26.00 | 676.00 | 0.23 | 123.33 | 12.33 | 152.12 | 0.11 | |
| 5 | 124 | 101.00 | 23.00 | 529.00 | 0.19 | 120.87 | 3.13 | 9.82 | 0.03 | |
| 6 | 108 | 113.33 | 5.33 | 28.44 | 0.05 | 121.49 | 13.49 | 182.08 | 0.12 | |
| 7 | 134 | 114.33 | 19.67 | 386.78 | 0.15 | 118.79 | 15.21 | 231.19 | 0.11 | |
| 8 | 153 | 122.00 | 31.00 | 961.00 | 0.20 | 121.84 | 31.16 | 971.20 | 0.20 | |
| 9 | 193 | 131.67 | 61.33 | 3761.78 | 0.32 | 128.07 | 64.93 | 4216.07 | 0.34 | |
| 10 | 187 | 160.00 | 27.00 | 729.00 | 0.14 | 141.06 | 45.94 | 2110.94 | 0.25 | |
| 11 | 193 | 177.67 | 15.33 | 235.11 | 0.08 | 150.24 | 42.76 | 1828.07 | 0.22 | |
| 12 | 247 | 191.00 | 56.00 | 3136.00 | 0.23 | 158.80 | 88.20 | 7780.09 | 0.36 | |
| 13 | 242 | 209.00 | 33.00 | 1089.00 | 0.14 | 176.44 | 65.56 | 4298.62 | 0.27 | |
| 14 | 197 | 227.33 | 30.33 | 920.11 | 0.15 | 189.55 | 7.45 | 55.52 | 0.04 | |
| 15 | 210 | 228.67 | 18.67 | 348.44 | 0.09 | 191.04 | 18.96 | 359.51 | 0.09 | |
| 16 | 216.33 | 216.33 | 194.83 | 194.83 | ||||||
| MAD = | 43.31 | MAD = | 46.46 | |||||||
| MSE = | 1066.72 | MSE = | 2277.33 | |||||||
| sigma = | 32.66 | sigma = | 47.72 | |||||||
| MAPE = | 0.163837708 | MAPE = | 0.29569601 |
All the three time-series data shows that we are getting lower estimates of error in the case of Moving Average. So we finalize the 3-year Moving average figures for all these time series data.
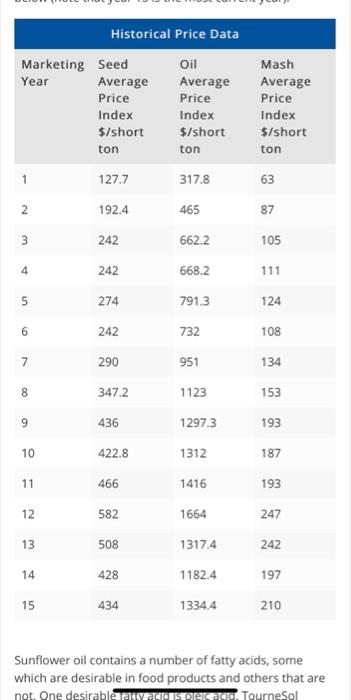
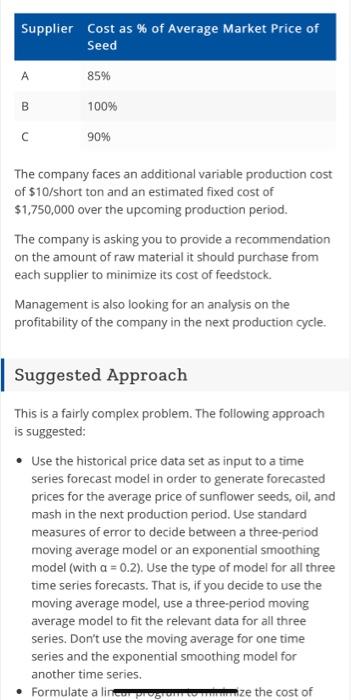
| Marketing Year | Seed | Oil | Mash |
| Average Price Index | Average Price Index | Average Price Index | |
| $/short ton | $/short ton | $/short ton | |
| 16 | 456.67 | 1278.07 | 216.33 |
--------------------------
Let XA, XB, and XC be the short tons of seeds procured from supplier A, B, and C. These are the decision variables.
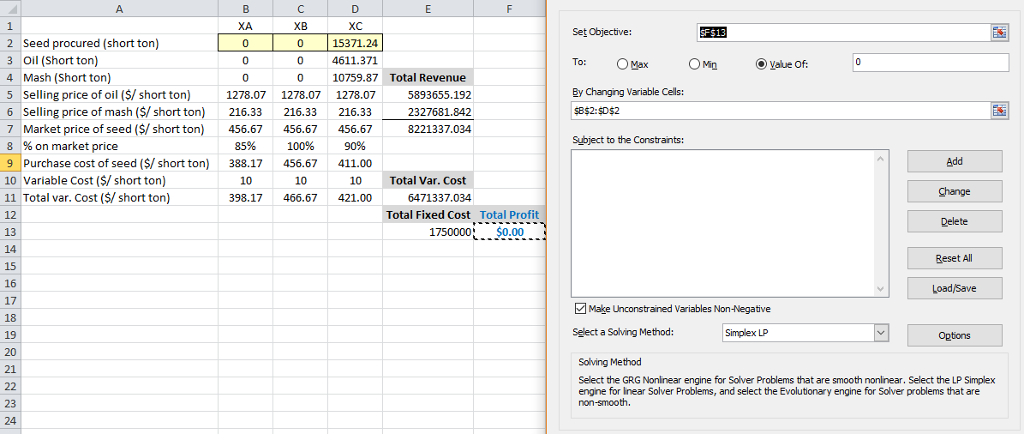
Formulation in Excel follows
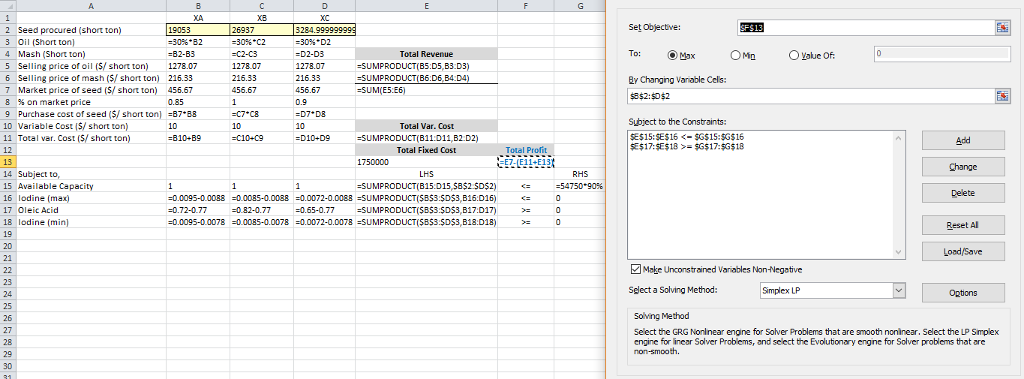
Final Solution
| XA | XB | XC | |||
| Seed procured (short ton) | 19053 | 26937 | 3285 | ||
| Oil (Short ton) | 5715.9 | 8081.1 | 985.5 | ||
| Mash (Short ton) | 13337.1 | 18855.9 | 2299.5 | Total Revenue | |
| Selling price of oil ($/ short ton) | 1278.07 | 1278.07 | 1278.07 | 18893069.78 | |
| Selling price of mash ($/ short ton) | 216.33 | 216.33 | 216.33 | 7461762.525 | |
| Market price of seed ($/ short ton) | 456.67 | 456.67 | 456.67 | 26354832.3 | |
| % on market price | 85% | 100% | 90% | ||
| Purchase cost of seed ($/ short ton) | 388.17 | 456.67 | 411.00 | ||
| Variable Cost ($/ short ton) | 10 | 10 | 10 | Total Var. Cost | |
| Total var. Cost ($/ short ton) | 398.17 | 466.67 | 421.00 | 21540008.13 | |
| Total Fixed Cost | Total Profit | ||||
| 1750000 | 3064824.172 |
CVP Analysis
The Breakeven point can be found again by using Solver, this time without any constraints and only equating total profit with zero.
The question perhaps tells us to calculate the breakeven without the considering the variable cost of purchase and to take the market price of seed only. In that case, there is no significance for taking 3 suppliers separately. So, we take, X as the break-even quantity.
Revenue at break-even = 1278.07*0.30*X + 216.33*0.7*X
Variable Cost at breakeven = (456.67+10)*X
Fixed Cost = 1750,000
At breakeven, total profit = 0 i.e. Revenue at break-even - Variable Cost at breakeven - Fixed cost = 0
Solving for X, we will get X = 25,667
If you Satisfy with Answer, Please give me "Thumb Up". It is very useful for me.
Thank you for your support.
If you have any doubts , feel free to put comment.

