Consider the following data set consisting of test scores of students in a math class: 22 26 26 2
Question
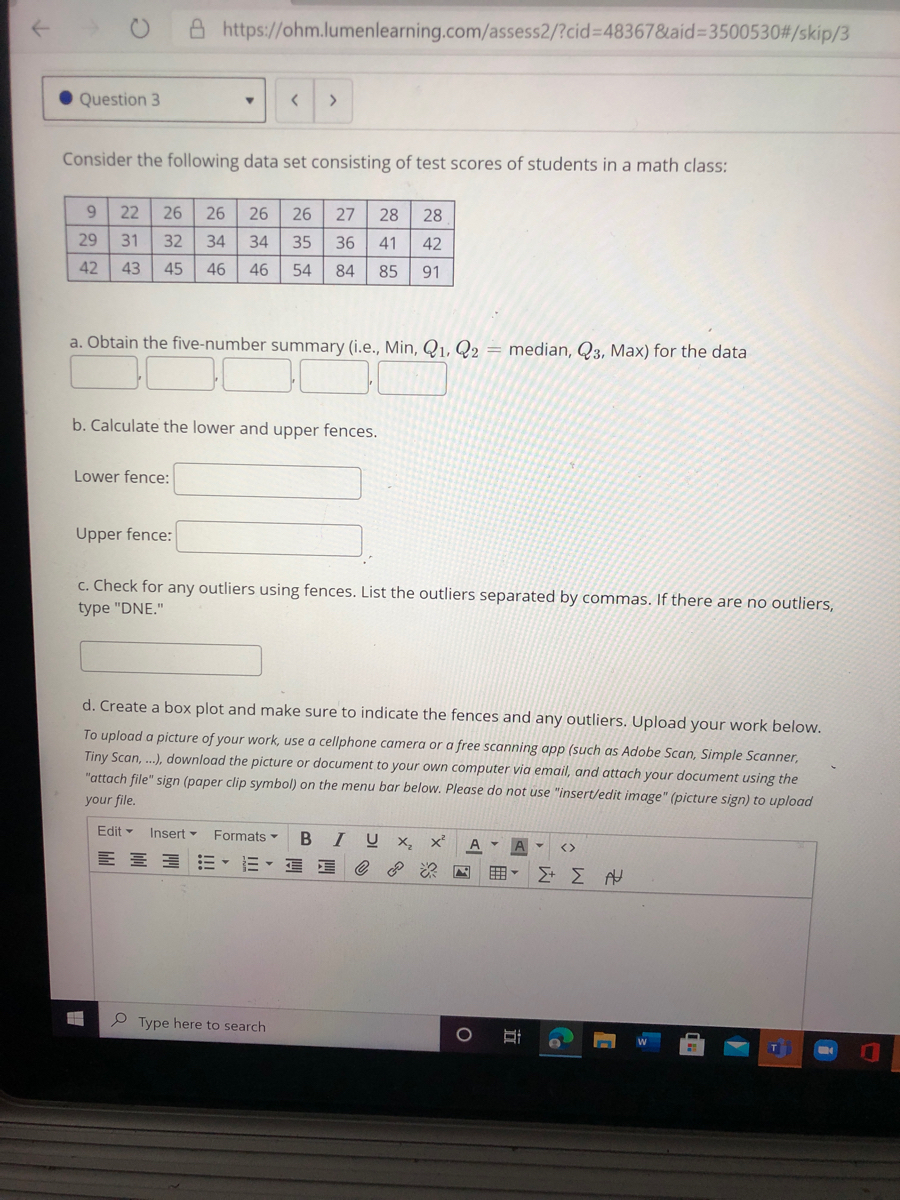
Image Transcriptionclose
Consider the following data set consisting of test scores of students in a math class: 22 26 26 26 26 27 28 28 29 31 32 34 34 35 36 41 42 42 43 45 46 46 54 84 85 91 a. Obtain the five-number summary (i.e., Min, Q1, Q2 = median, Q3, Max) for the data b. Calculate the lower and upper fences. Lower fence: Upper fence: c. Check for any outliers using fences. List the outliers separated by commas. If there are no outliers, type "DNE." 9,
5 - Number Summary :
The five number summary gives you a rough idea about what your data set looks like.
The five number summary includes 5 items:
- The minimum.
- Q1 (the first quartile, or the 25% mark).
- The median.
- Q3 (the third quartile, or the 75% mark).
- The maximum.
- Minimum :
The minimum is the smallest value in a data set.
Ordering the data from least to greatest, we get:
9 22 26 26 26 26 27 28 28 29 31 32 34 34 35 36 41 42 42 43 45 46 46 54 84 85 91
So, the minimum is 9.
- First Quartile (Q1) :
The first quartile (or lower quartile or 25th percentile) is the median of the bottom half of the numbers. So, to find the first quartile, we need to place the numbers in value order and find the bottom half.
9 22 26 26 26 26 27 28 28 29 31 32 34 34 35 36 41 42 42 43 45 46 46 54 84 85 91
So, the bottom half is
9 22 26 26 26 26 27 28 28 29 31 32 34
The median of these numbers is 27.
- Second Quartile (Q2) / Median :
The median is the middle number in a sorted list of numbers. So, to find the median, we need to place the numbers in value order and find the middle number.
Ordering the data from least to greatest, we get:
9 22 26 26 26 26 27 28 28 29 31 32 34 34 35 36 41 42 42 43 45 46 46 54 84 85 91
So, the median is 34 .
- Third Quartile (Q3) :
The third quartile (or upper quartile or 75th percentile) is the median of the upper half of the numbers. So, to find the third quartile, we need to place the numbers in value order and find the upper half.
9 22 26 26 26 26 27 28 28 29 31 32 34 34 35 36 41 42 42 43 45 46 46 54 84 85 91
So, the upper half is
35 36 41 42 42 43 45 46 46 54 84 85 91
The median of these numbers is 45.
- Maximum :
The maximum is the greatest value in a data set.
Ordering the data from least to greatest, we get:
9 22 26 26 26 26 27 28 28 29 31 32 34 34 35 36 41 42 42 43 45 46 46 54 84 85 91
So, the maximum is 91.
To find outliers and potential outliers in the data set, we first need to calculate the value of the inner fences and outer fences.
- The inner fences are defined by:
Q1−(1.5⋅IQR) and Q3+(1.5⋅IQR)
For this data set: 27−(1.5⋅18) and 45+(1.5⋅18)
Inner fences: 0 and 72
- The outer fences are defined by:
Q1−(3⋅IQR) and Q3+(3⋅IQR)
For this data set: 27−(3⋅18) and 45+(3⋅18)
Outer fences: −27 and 99
If there are any outliers in this data set, they will either be less than -27 or greater than 99. Potential outliers will be between -27 and 0, inclusive or between 72 and 99, inclusive.
In this data set, there are no outliers.
In this data set, the potential outlier(s) is/are: 84, 85, 91

